Projects
Graduate
Image Diffusion Through Social Media During Disaster
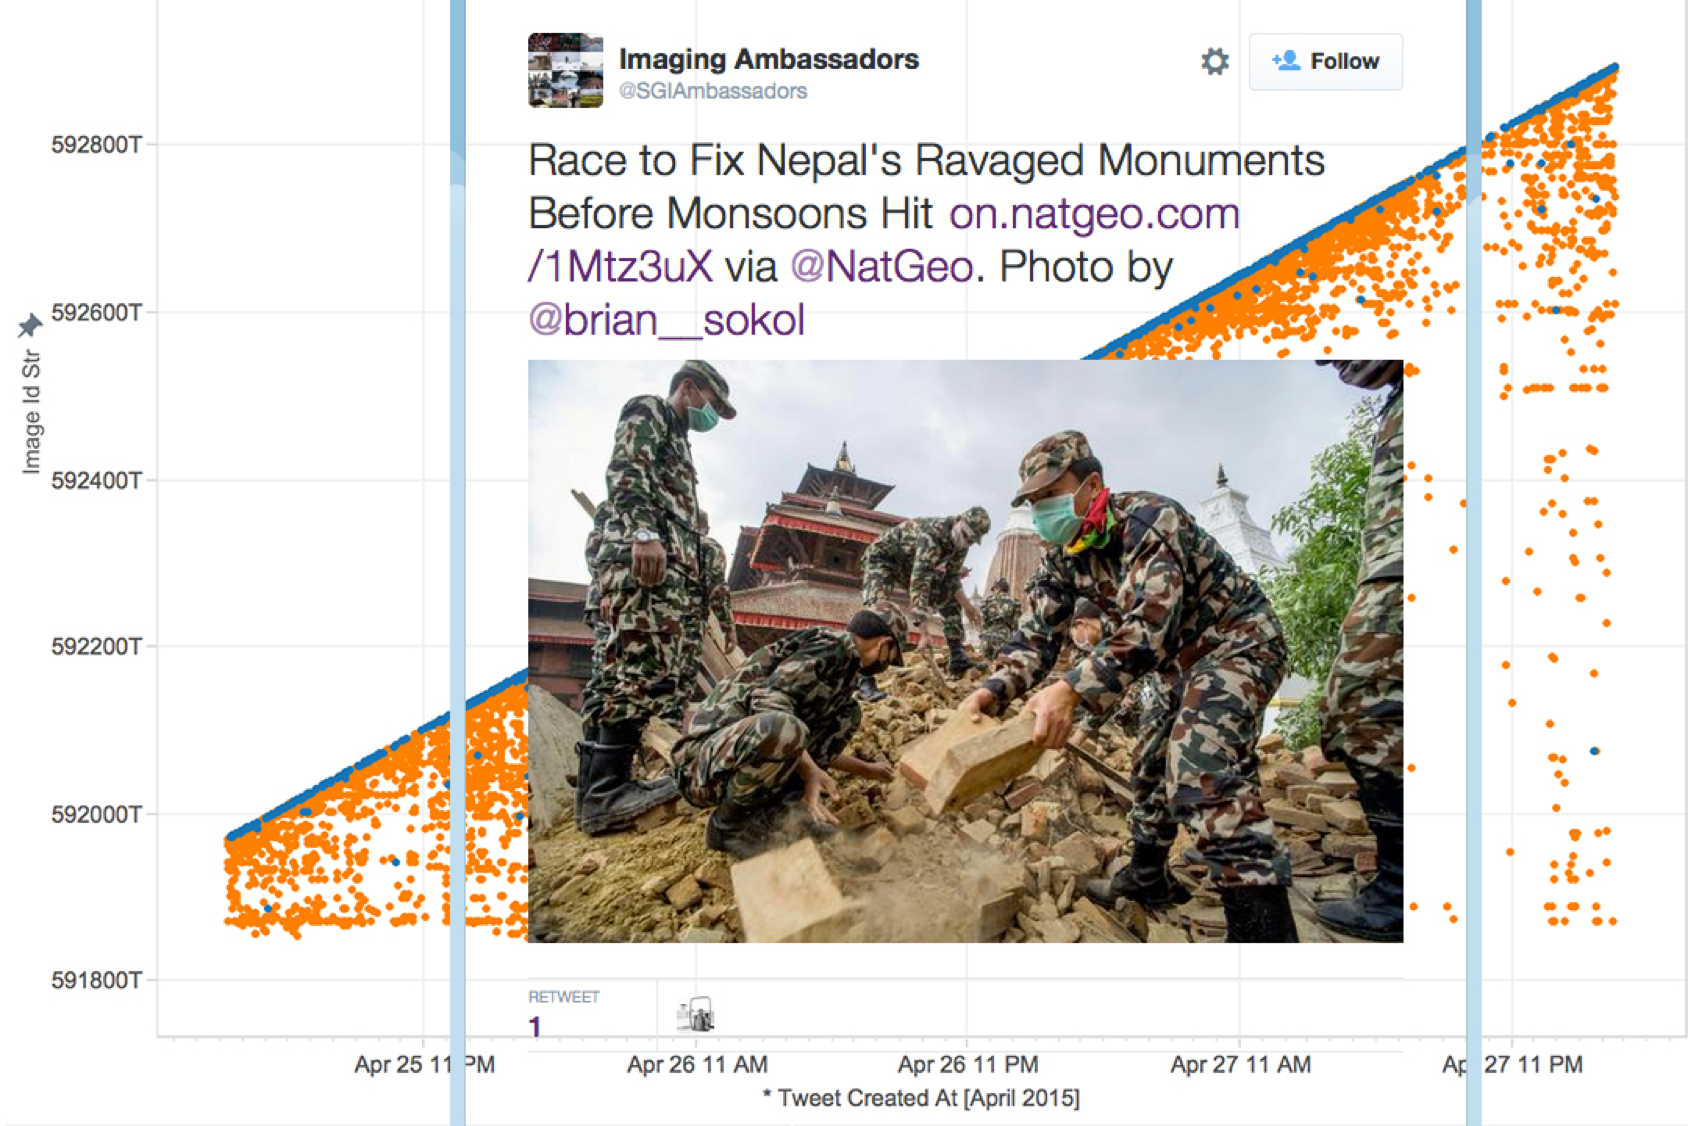
I am currently working on a research project focusing on how images diffuse through social media and what kinds of visual information are important to different people during and after disasters. Working with a set of over 1 million tweets containing images collected during the aftermath of the Nepal earthquake in April 2015, I am creating visualizations to show trends and patterns in the data based on image content and other tweet metadata. Based on previous work done by others working in Project EPIC on textual Twitter data, I expect to see differences in images posted by people local to the earthquake versus the global public.
News and the Social Life of Disaster Images

I recently contributed to a submission to the Knight Foundation News Challenge on how to make data work for individuals and communities. Our project focuses on what journalists can learn from how images of disaster spread through social media. To better inform news reporting on disaster and fuel stories for the Between Fire and Ice transmedia journalism project at CU Boulder, this interdisciplinary collaboration will statistically analyze how images spread through social media during disasters, examine why certain images circulate more widely than others, and identify what kinds of images are valuable to the local community versus a global public.
RendezView: Interactive Visual Data Mining

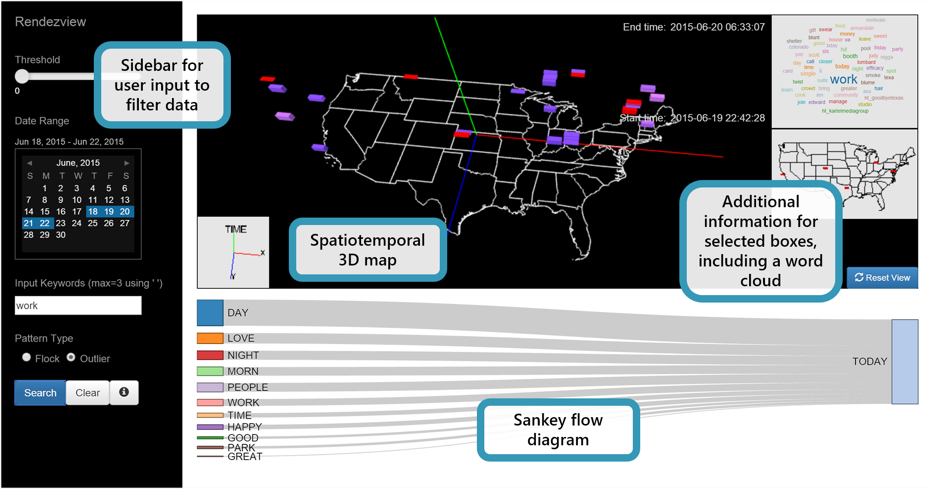
I implemented an interface for an interactive data visualization framework which shows flock patterns and relationships in complex data, particularly data from social media platforms such as Twitter. This research project was done at the National Institute of Advanced Industrial Science and Technology (AIST) in Tsukuba, Japan as part of the OSDC PIRE Fellowship. A poster of this work was accepted to the 2015 Supercomputing Conference, and a full paper was accepted to IWGS 2015.
Abstract: Social media data provide insight into people’s opinions, thoughts, and reactions about real-world events. However, this data is often analyzed at a shallow level with simple visual representations, making much of this insight undiscoverable. Our approach to this problem was to create a framework for visual data mining that enables users to find implicit patterns and relationships within their data, focusing particularly on flock phenomena in social media. Rendezview is an interactive visualization framework that consists of three visual components: a spatiotemporal 3D map, a word cloud, and a Sankey flow diagram. These components provide individual functions for data exploration and interoperate with each other based on user interaction. The current version of Rendezview can represent local topics and their co-occurrence relationships from geo-tagged Twitter messages.
Natural Language Queries for Producing Data Visualizations

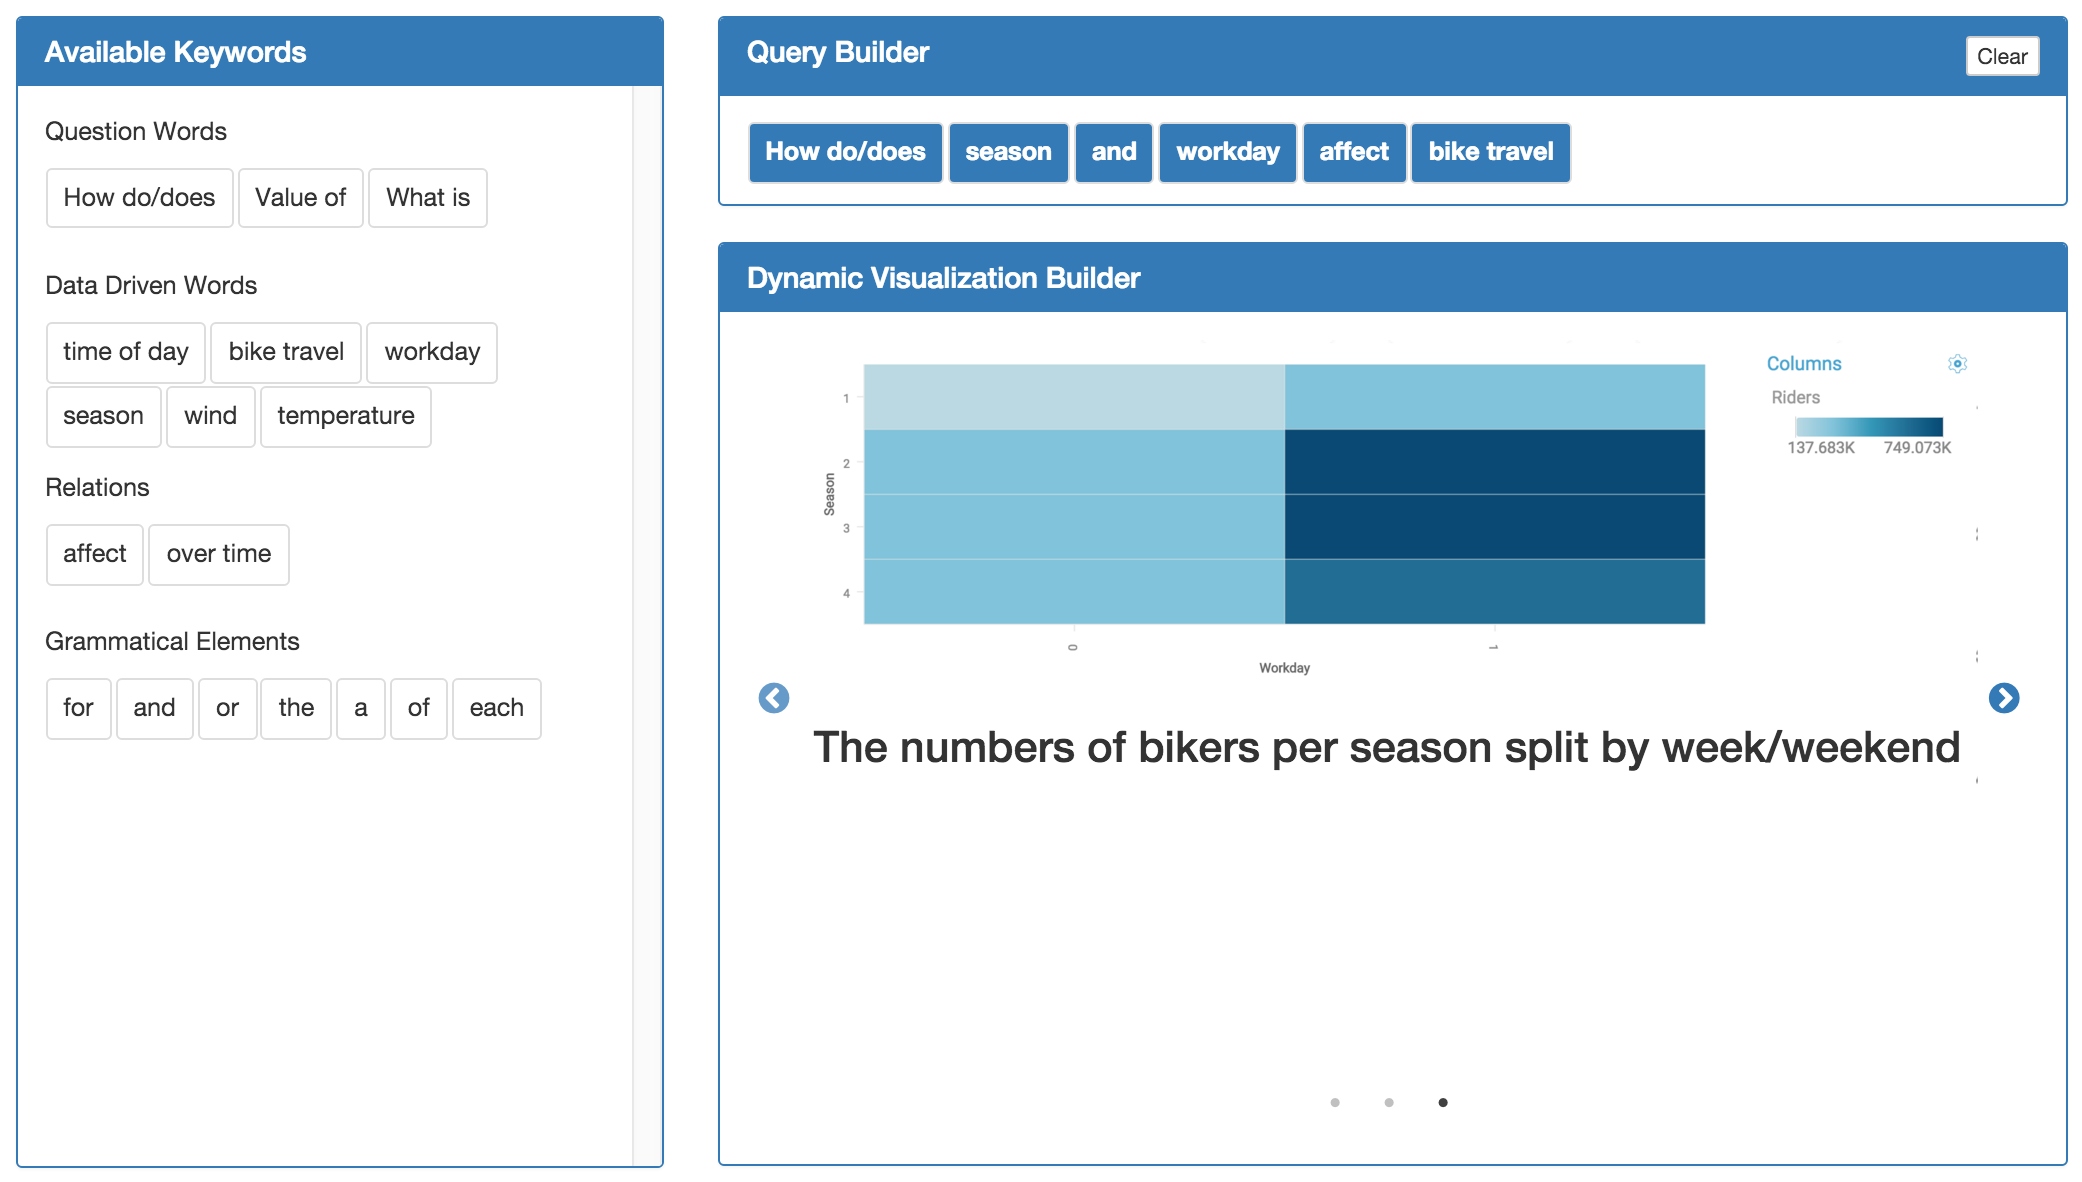
This was a team project for the User-Centered Design class. I came up with this idea after using different data visualization tools and noticing a gap between what I actually want to see in a visualization and what kind of input the tools provide to users. Our goal was to create a tool that allows users to input database queries in natural language to lessen this gap and ease the transition from data to analysis. Learn more by reading the final paper or exploring the GitHub repo.
Abstract: Tools exist to enable users to filter and visualize their data based on queries; however, these queries often use unfamiliar and unnatural language, making it difficult to see the relation between the query and the resulting visualization. We have designed a tool in which a user can choose from a bank of natural language keywords, which includes data-specific words as well as words used for grammatical correctness, to build a natural language research question or query and be presented with data visualizations that aim to answer the query. We followed a user-centered design process, iterating upon our design based on results from thinking aloud user testing. In this paper, we present relevant work which motivated the project, key requirements and challenges, and our evaluation of how our final design addressed the challenges found via user testing.
Undergraduate
SMS-Based Training System for Global Social Enterprises
My senior engineering design project at Santa Clara University was inspired by my experience as a Global Social Benefit Fellow, where I worked in Kolkata, India with social enterprises Anudip and iMerit to start an information technology training program. Text to Learn is a training tool made with social enterprises in mind that uses SMS to distribute training materials and to test users on their learning. Our goal was to give social enterprises a way to train employees and customers digitally and remotely. We created an online dashboard, using RapidSMS and a cloud storage service, for social enterprises to upload and send training materials, manage users, and create SMS-based quizzes to assess users’ progress.
This project was fully funded from the Willem P. Roelandts and Maria Constantino-Roelandts Grant which funds faculty and student research projects that use science and technology for social benefit. Our full project, including presentation and thesis, won Best in Session at the annual Senior Design Conference.
Mobile Application to Benefit Local Homeless
This was a project I worked on as a junior at Santa Clara University in the Mobile Projects for Social Benefit course. Based on the knowledge that the majority of homeless people use mobile phones, I collaborated with a team of eleven students to develop a mobile application for Community Technology Alliance to aid homeless people in the Bay Area in finding services local to them, including food, shelter, health, and job opportunities. I contributed primarily to the user interface design using HTML and CSS. The project has since been further implemented by Santa Clara University students and CTA into an app called StreetConnect.